Calculate Gene B Recovery
Bvalcalc --gene --params Params.py
- --gene
Calculate B values for a range of neutral sites flanking a single selected element.
Core Arguments
- --params [path/to/YourParams.py]
Path to a Python file defining population genetic parameters, see here for accessing pre-built templates, Generate Parameters, and here for adjusting parameters to new species/populations, Tailoring Parameters.
- --element_size [int]
Total length of the selected region, e.g. gene or exon, (default: 10000).
- --flank_len [int]
Length of the flanking neutral region to calculate B (default: 40000)
Optional Arguments
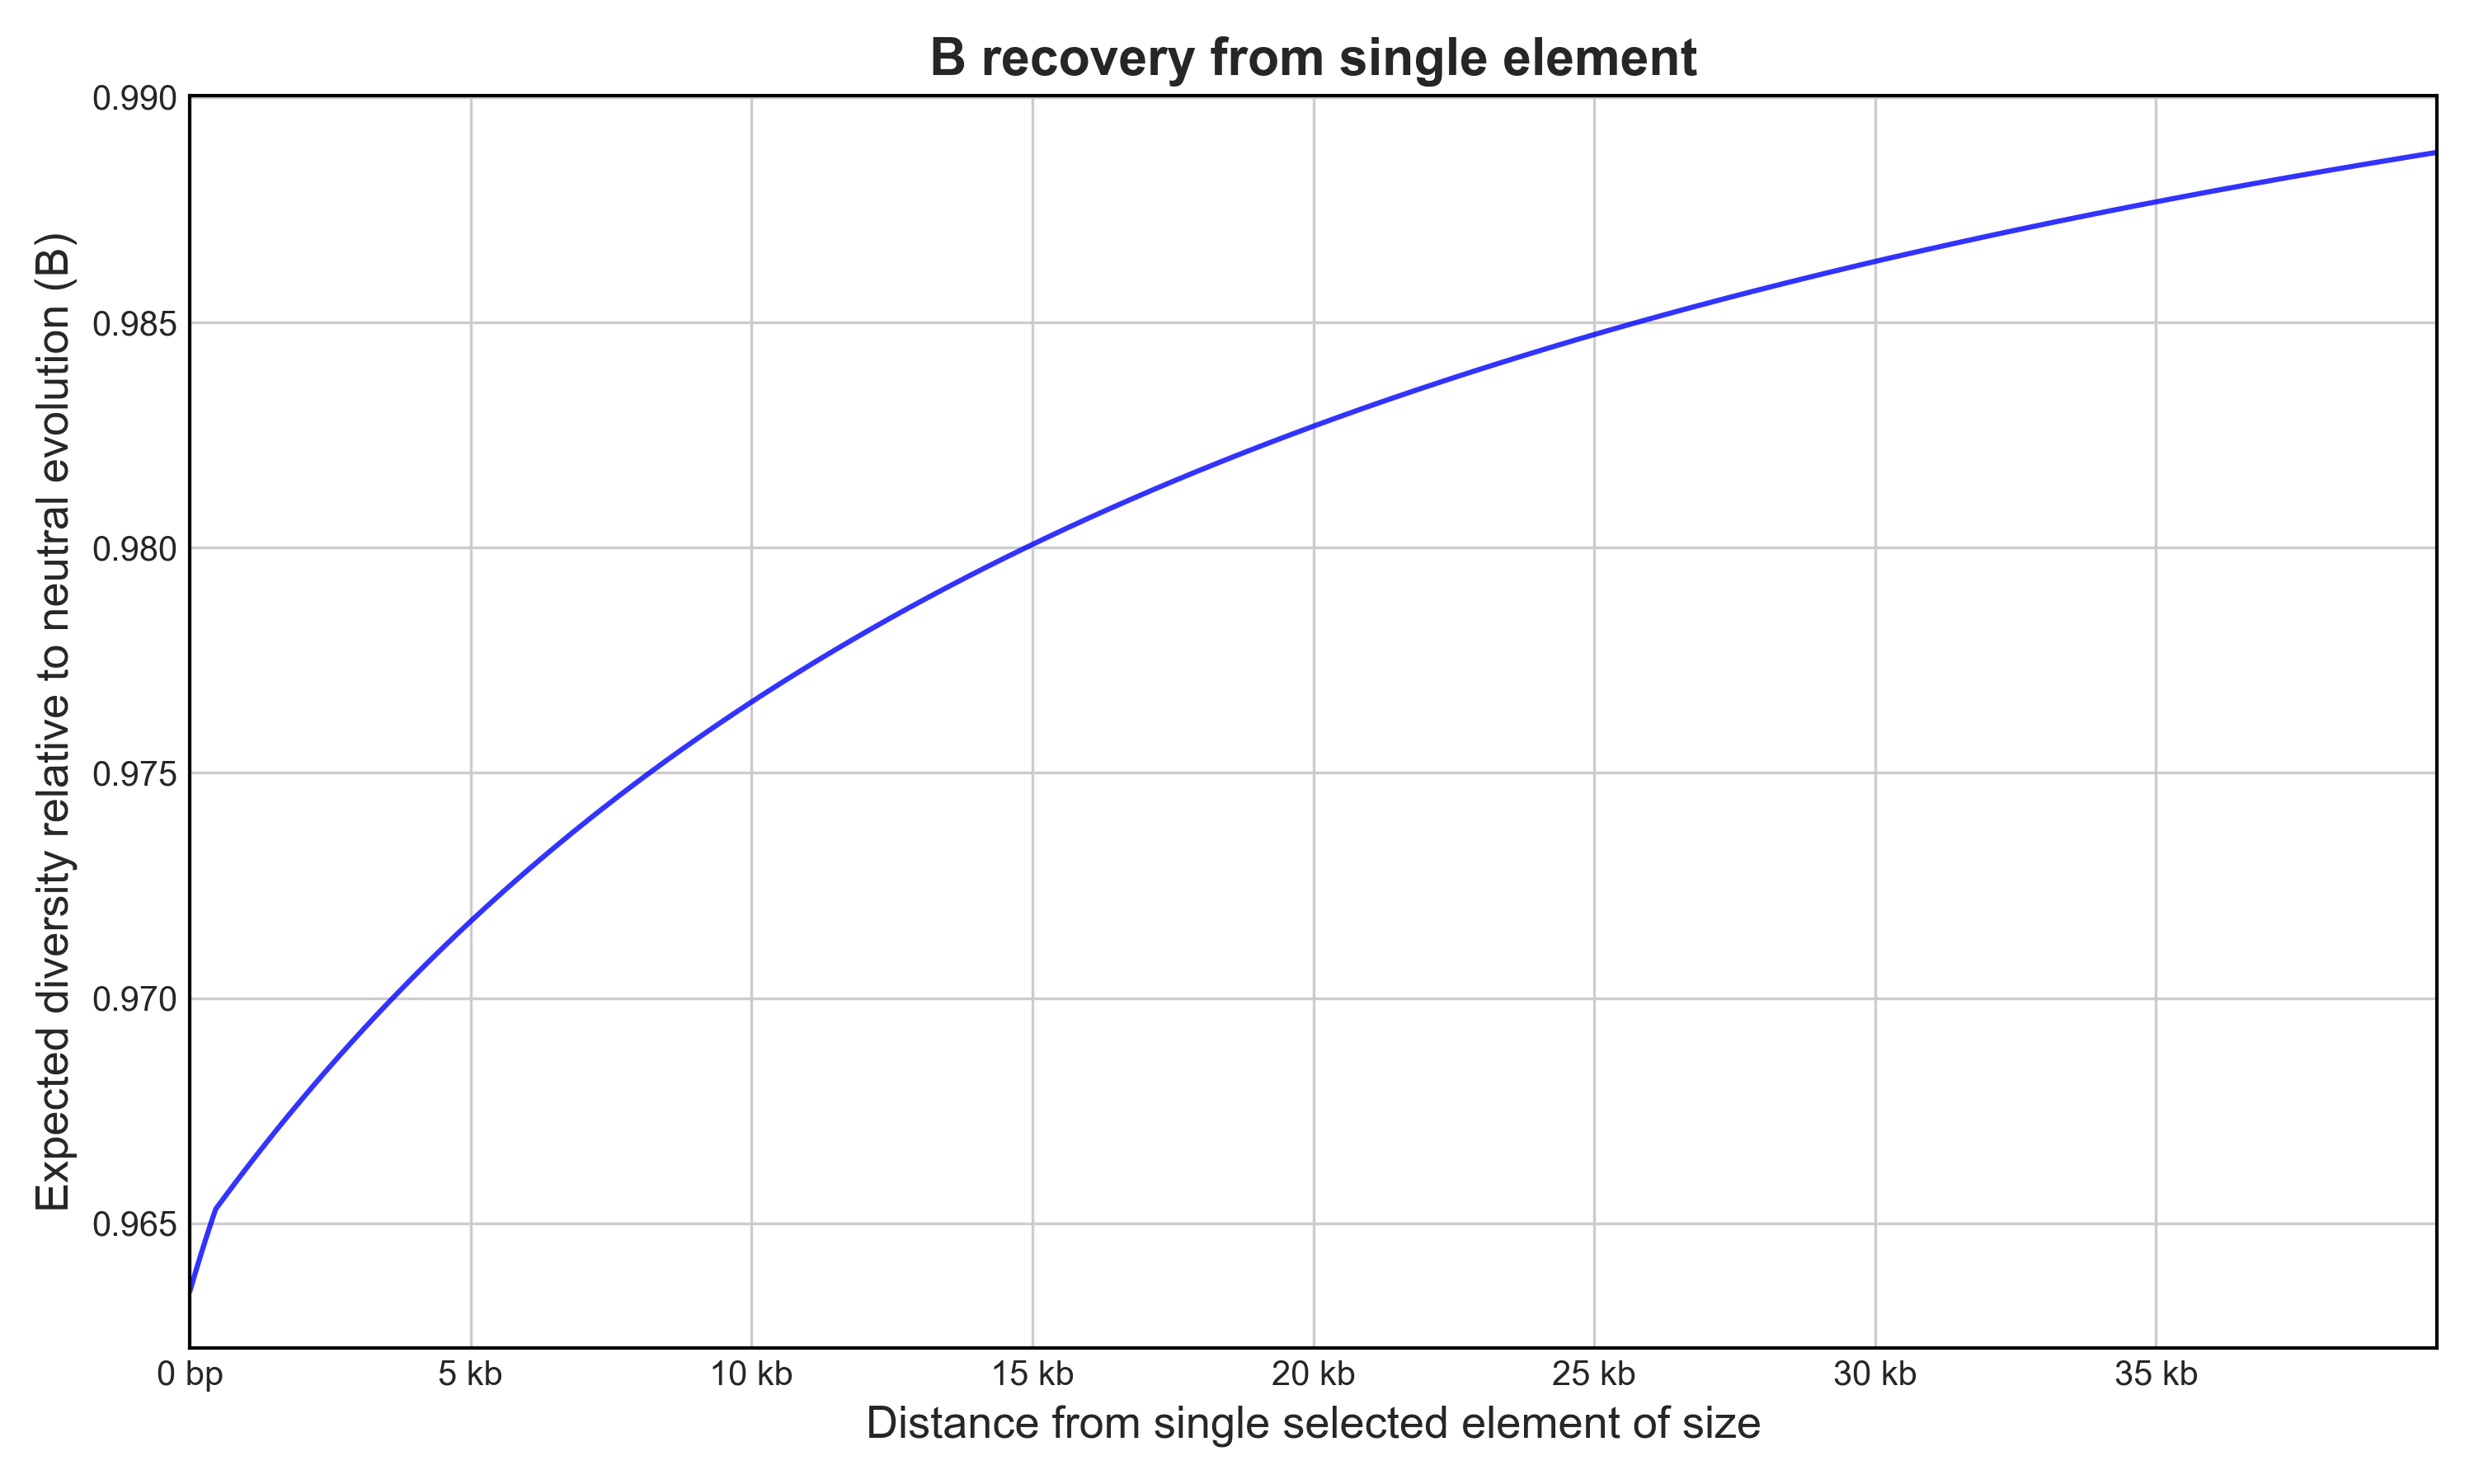
- --plot [path]
Generate a B recovery slope output with a specified path (default: ./Bplot.png if no path is given)
- --out [path]
Write B-values to a CSV file with the specified path (must also provide
--out_binsize)- --out_binsize [int]
Bin size to average B-values in the CSV output, required if
--outis used.- --pop_change
If included, compute current B (
Bcur) under a step population size change, as described in Johri et al. (2021). Note thatBcurandtime_of_changeshould be set in the parameters file when active.- --gamma_dfe
If included, use a gamma distribution to define the DFE using a grid of selection coefficients from 1 to 1e-8 in 10-fold steps (instead of the basic DFE parameters set by
f0,f1,f2,f3). Adding this flag overrides the basic DFE parameters set byf0,f1,f2,f3). Note thatmean,shapeandproportion_synonymousshould be set in the parameters file when active.- --constant_dfe
If included, use a constant fixed
svalue as the DFE of selected sites (instead of the basic DFE parameters set byf0,f1,f2,f3). Adding this flag overrides the basic DFE parameters set byf0,f1,f2,f3). Note thatsandproportion_synonymousshould be set in the parameters file when active.- --custom_dfe
If included, set the discrete breakpoints for homozygous selection coefficients
s_breakswithin which uniform distributions are modelled with proportions set bybin_proportions. Setting this overrides the basic DFE parameters set byf0,f1,f2,f3). Note thats_breaksandbin_proportionsshould be set in the parameters file when active.- --quiet
Suppress console output
Example
Bvalcalc --gene \
    --params HomSap_Cds_Params.py \
    --element_size 10000 \
    --flank_len 40000 \
    --plot ./Bplot.png

# B for adjacent site: 0.9617168921951618
# Mean B for flanking region: 0.979953881508711
Calculates B for a 40 kb neutral region flanking a single gene under selection of length 10 kb using template human CDS parameters, and plot the output.